For distribution system operators, grid owners and grid-connected solar parks. Analyses and tools built on data the operator already collects, with no new equipment, and results the technical team can use straight away.
Utilities and power grids
GIS data governance
When nobody is responsible for a data layer, it goes out of date. Governance sets out who updates it, by which rules and how suppliers are checked.
responsibilities for each data category and each supplier;
identifiers, attribute standards and metadata;
quality, currency and consistency of data across sites;
GIS maintenance contracts and their indicators.
What you get
a data governance framework and quality standards;
a GIS maturity assessment with a roadmap;
on request, a monthly or quarterly report monitoring GIS suppliers.
DeliverableGIS Data Governance Framework + maturity report.
Momentary power interruptions
Award-winning: Esri (EGUC) and NISC · featured in Esri Map Book, Vol. 26
Interruptions lasting between 3 seconds and 3 minutes are not counted in duration indicators, but they add up. Customers notice them, sensitive equipment trips, and the performance standard limits how many there can be. Knowing where they happen is not enough: field crews need to know why.
Romanian regulator ANRE: short interruption = 3 s < t ≤ 3 min · MV/LV: max. 10 per week per connection point · MAIFI indicator · EN 50160
What we analyse
the short-interruption log from smart meters (AMI/HES), with the time of each event and the voltage-loss and voltage-restore signals;
the GIS topology: service connection → phase → substation → feeder, with the upstream recloser;
the asset register: age and type of insulators, transformers and reclosers;
wind, rainfall and vegetation index from satellite imagery.
What you get
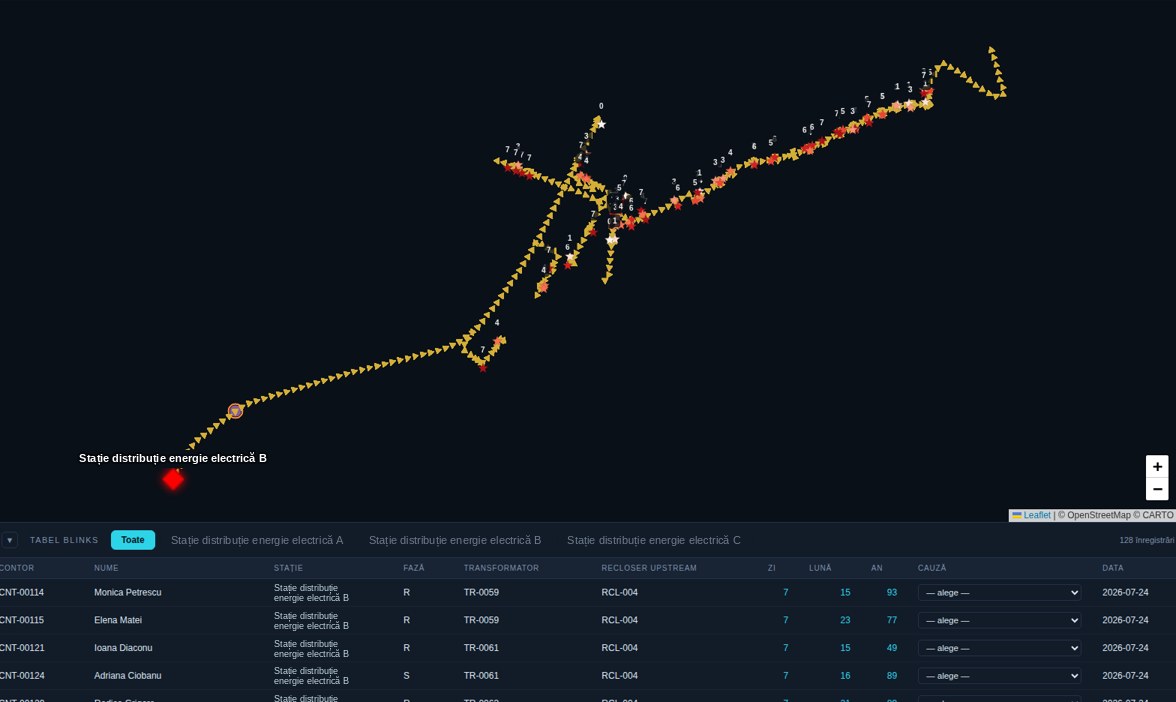
a map of events by substation, feeder and meter;
the probable cause for each group of events: external (vegetation, animals, weather), internal (degrading equipment) or no fault (planned work, protection operating normally);
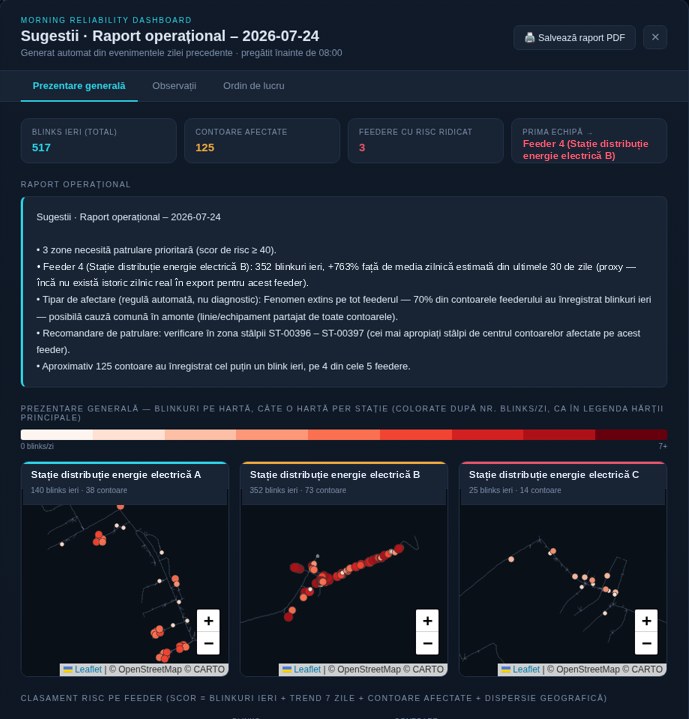
a risk ranking of feeders and the areas to patrol;
a prioritised list of interventions: vegetation clearing, protection settings, replacements.
Deliverablemap application with a daily report + GIS layer with critical areas.
Advantages
Diagnosis, not just location.
Separates external causes from equipment causes and removes events that do not point to a fault.
No SCADA, no new hardware.
Uses only smart meter data and the GIS topology the operator already has.
Hidden faults come to light.
What remains once external causes are excluded becomes a signal of degrading equipment, before it fails.
Works from day one.
Starts with rules, at any level of topology detail, and becomes more accurate as crews confirm causes.
The application
Short-interruption map and morning report
The prototype already runs on a demonstration grid with synthetic data. It is configured for each operator through data adapters, not as a one-off integration.
Topology chain:
meter
phase
transformer
feeder
substation
Map by substation and feeder, with the direction of supply and the MAIFI and SAIDI indicators for the selected area.
Meter table: substation, phase, transformer, upstream recloser, number of events per day, month and year, plus the cause confirmed by the field crew.
Correlation on the grid graph: when several meters on the same phase and transformer are affected at once, the cause is shared at that level, not at the service connection.
Operational report generated automatically before 8:00: risk score per feeder (yesterday’s events, 7-day trend, meters affected, spread on the map), the poles between which to patrol and the order for the crews, with PDF export.
Solar prosumers, growing demand and long low-voltage lines push voltage outside its limits. The problem shows up on particular substations and feeders, not everywhere, and usually at particular times of day.
LV: +5% / −10% of nominal voltage for 95% of 10-minute averages over a week · MV/HV: ±10% for 99%, none beyond ±15% · EN 50160
What we analyse
voltage recorded by smart meters and power quality analysers, linked to connection points in the GIS;
compliance per substation, feeder and phase, week by week;
the usual profile of each substation by hour, day and season, so that new deviations stand out;
overvoltage at peak solar hours, undervoltage at line ends, line length, conductor cross-section and prosumer capacity.
What you get
a voltage compliance map by substation, feeder and phase;
a list of locations with repeated deviations, separated from explainable ones (planned work, known solar peaks);
a list of meters assigned to the wrong phase or substation in the GIS;
recommendations: tap settings, phase balancing, grid reinforcement.
Illustrative chart: one day at a distribution substation, with the permitted +5% / −10% band.
Deliverablecompliance report + GIS layer with deviations, on the same map as short interruptions.
Advantages
No new equipment.
Where meters record voltage, there is no need for extra analysers or SCADA integration.
A threshold for every substation.
Each substation is compared with its own profile, not a grid average, so false alarms drop.
Fixes the GIS too.
Meters whose voltages move together sit on the same phase and transformer, so wrong assignments in the GIS come to light.
Same data, two problems.
The topology and meters used for short interruptions also serve voltage analysis, so set-up is done once.
Equipment inventory with GIS
The inventory of poles, switches and transformers usually lives in several sources that do not match: GIS, the fixed-asset register, inspection sheets and aerial imagery.
One inventory: GIS, the fixed-asset register and the field, with a unique code on every element
What we analyse
completeness and consistency of the inventory across GIS, registers and the field;
telecom attachments on every pole, compared with what operators have declared;
What you get
a reconciled GIS inventory, with a unique code on every pole and asset;
a report of missing or contradictory data, with a remediation plan;
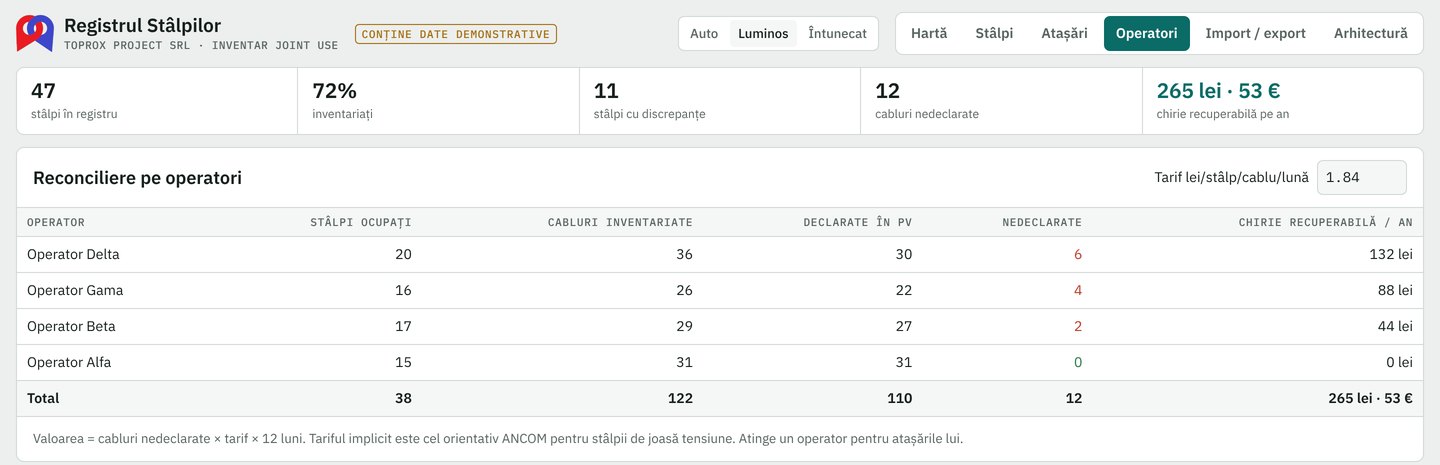
a register of telecom attachments on each pole, with undeclared cables and the rent to recover.
Deliverablereconciled GIS inventory + Pole Register.
Advantages
Revenue lost today.
Every cable fitted without a contract becomes a concrete amount to invoice, per operator.
Starts from your existing GIS.
Poles are imported from the GIS; in the field, crews only add the tag, condition and attachments.
A unique code on every pole.
The QR label can be read from the ground, from a vehicle or from drone imagery.
Standard GIS formats.
Data goes back into ArcGIS, QGIS or PostGIS, in Stereo 70 or WGS 84.
From our portfolio
Pole Register
An inventory of attachments on distribution grid poles: who has cables on each pole, how many are declared in the official record and what the difference is worth. A TopRox Project application, at working-prototype stage.
Workflow:
GIS import
tag on the pole
field inventory
reconciliation
GIS export
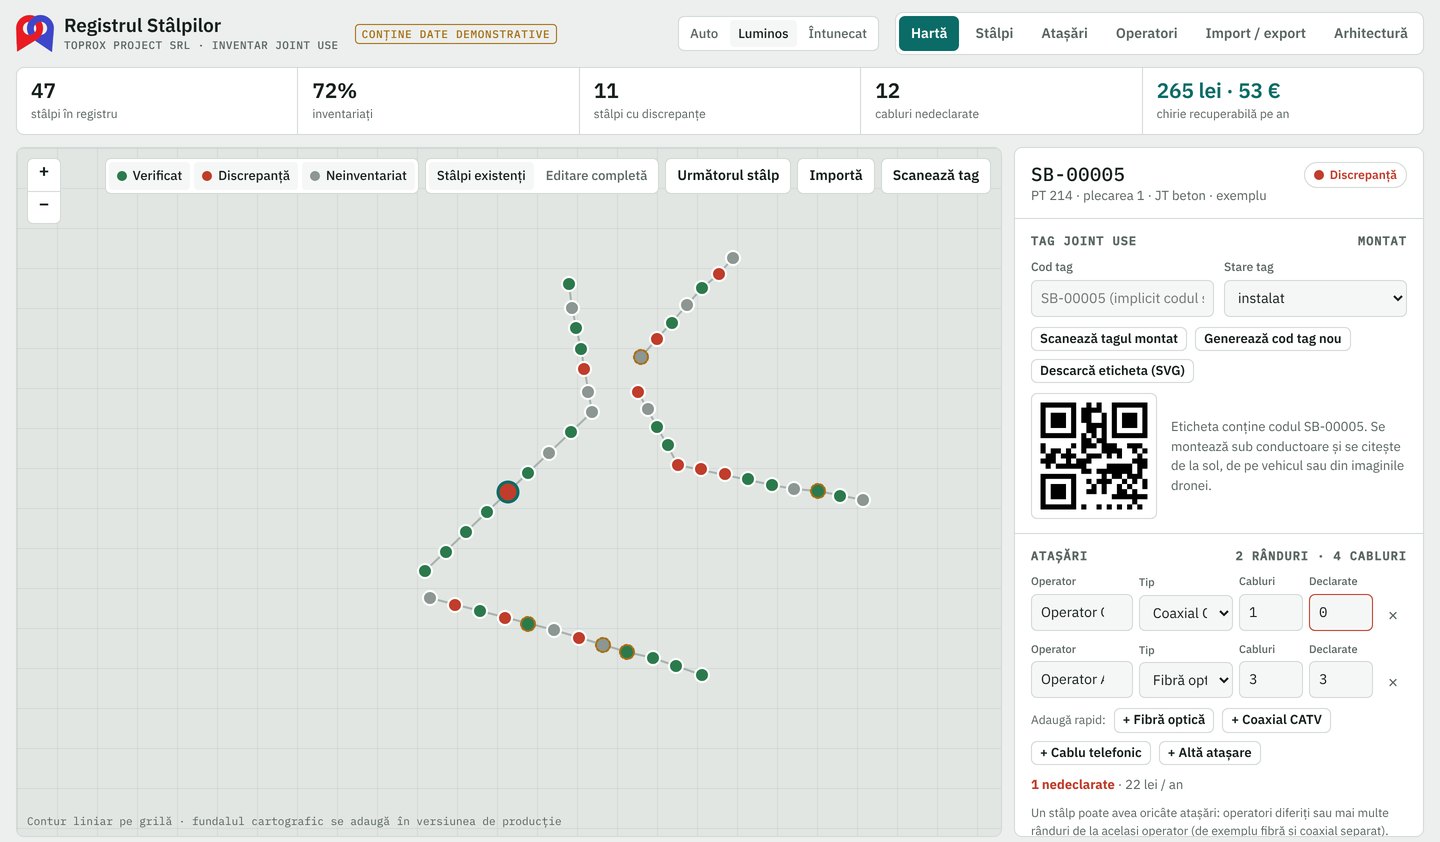
Map with the status of every pole: verified, with a discrepancy or not yet inventoried, by circuit and feeder, with a quick jump to the next pole to inventory.
Pole record: type, visual condition (leaning, cracked, vegetation, corrosion), a printable QR tag and each operator’s attachments: fibre, coaxial, telephone cable, enclosures.
Reconciliation by operator: inventoried cables compared with declared ones and the recoverable rent per year, calculated from the indicative tariff of the Romanian telecom regulator for low-voltage poles, which can be changed.
GIS import and export: Shapefile, GeoPackage, GeoJSON, Esri JSON, KML and CSV, with automatic conversion from Stereo 70, plus an SQL package for PostGIS.
Inspections produce photos, record sheets and aerial imagery, but these rarely reach the map, linked to the asset inspected. Without that link, intervention priorities remain a guess.
Intervention priority = technical condition × importance in the grid (customers supplied, power, access)
What we analyse
existing inspection data and drone or LiDAR imagery supplied by the operator or its contractors;
age, material, reported defects and failure history of each asset;
the importance of each element in the grid topology.
What you get
a risk register for poles and equipment;
a prioritised list of replacements and repairs, on a map;
requirements for the next inspection campaign;
Deliverablecondition and risk assessment + risk-based maintenance plan.
The momentary outage and voltage monitoring applications received awards from Esri at EGUC and from NISC, for Excellence in Service and Innovation in Technology. The momentary outage application (Blinks) was featured in Esri Map Book, Vol. 26.
How we work
We start with a pilot project on one area or park, with objectives, deliverables and a deadline agreed in writing. We work remotely from Romania and on site anywhere in the EU, with scheduled visits. Reports are delivered in Romanian or English.
What is not included
The application reads periodic exports from existing systems and does not replace them: the operator’s GIS, SCADA and OMS stay as they are. We do not install equipment, migrate data, digitise the grid or carry out design work. The recommended measures remain the responsibility of the operator and its suppliers.
Let’s talk about your data.
Tell us which grid, area or cemetery you would like us to assess and we will propose a pilot project with clear deliverables and a clear deadline.
References for the thresholds quoted: ANRE Order no. 46/2021 (Performance standard for the electricity distribution service), arts. 6, 17, 20, 25; EN 50160:2011; Romanian Law no. 102/2014.
Contact
Let’s talk
Tell us how we can help and we will reply within one working day.