
Solutions
GIS for the environment
Terrain, water and climate analysed on the map: from landforms to the hazards that threaten settlements and infrastructure. The analyses draw on the founder’s expertise in geomorphology.
GIS for the environment
A TopRox Project product · pilot phase
EGIE – an analysis engine for adapting cities to climate risks
EGIE takes geographic and climate data about a city, turns it into indicators and applies explainable rules. The result does not just say “there is a risk”: it shows which rule was triggered, on what evidence, against which threshold and with what level of confidence. It is not a single, opaque score: phenomena, evidence and rules stay separate and can be checked.
- data
- indicators
- rules
- evidence
- validation
- report
11 climate rules (R1–R11):
- R1 urban heat
- R2 population exposure
- R3 access to green space
- R4 green space fragmentation
- R5 urban expansion
- R6 green deficit
- R7 tree canopy
- R8 cooling capacity
- R9 urban compactness
- R10 dangerous heat
- R11 flood risk
Status: the rule engine, indicator formulas, spatial tests and report generation have been tested in the lab. Some validation on real data and large-scale validation are still under way during the pilot phase.
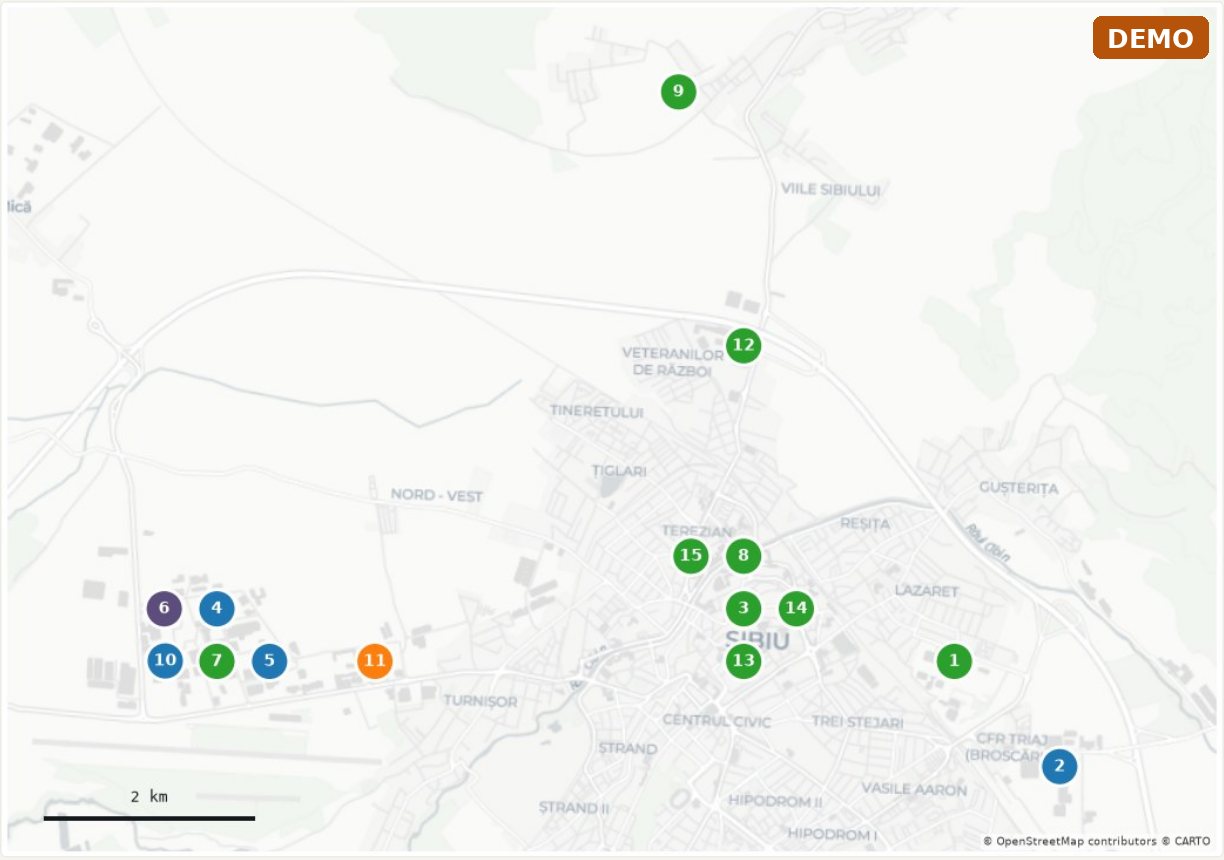
Demo report: Sibiu
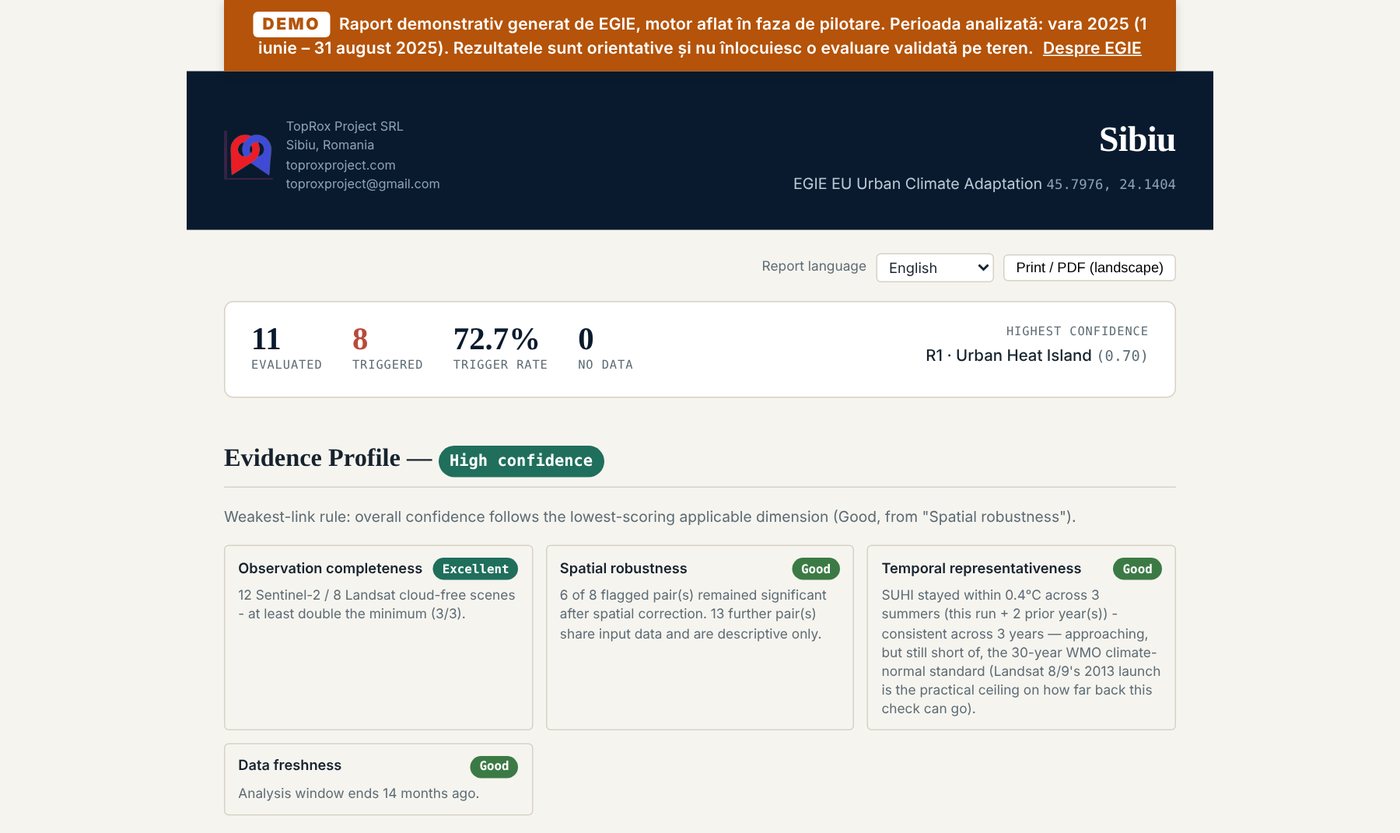
Period analysed: summer 2025, 1 June – 31 August 2025
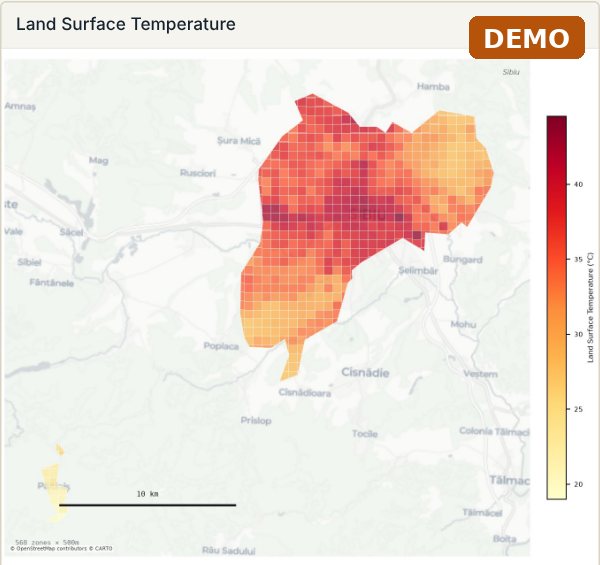
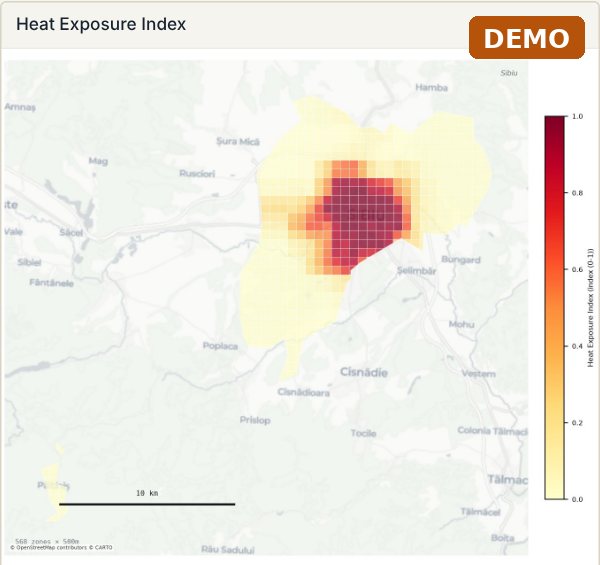
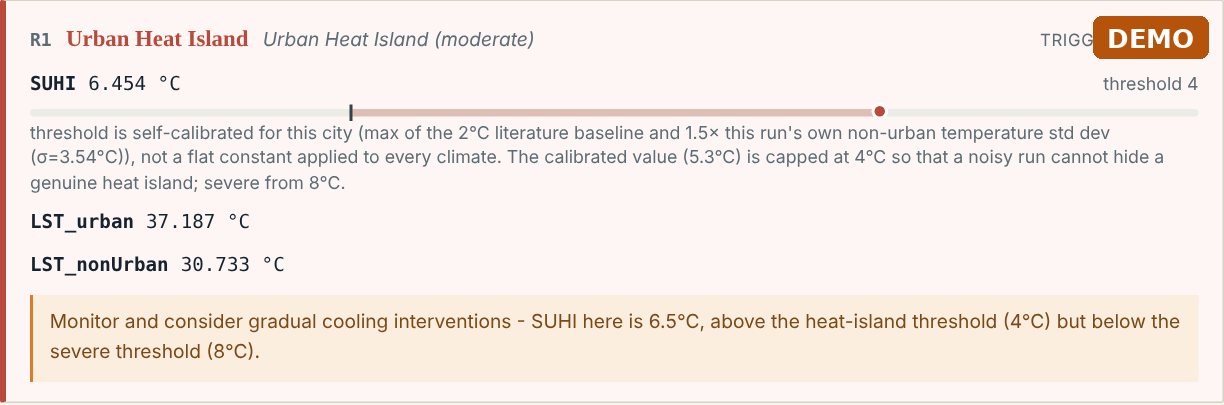
A real report generated by EGIE for Sibiu, marked DEMO. It opens in the browser with interactive maps and can be printed to PDF. The report is in English, with a language selector.
 Open the full-size image (opens in a new tab)
 Open the full-size image (opens in a new tab)
 Open the full-size image (opens in a new tab)
 Open the full-size image (opens in a new tab)
 Open the full-size image (opens in a new tab)
Geomorphological analysis
The shape of the land explains where water collects, where slopes slide and where it is safe to build.
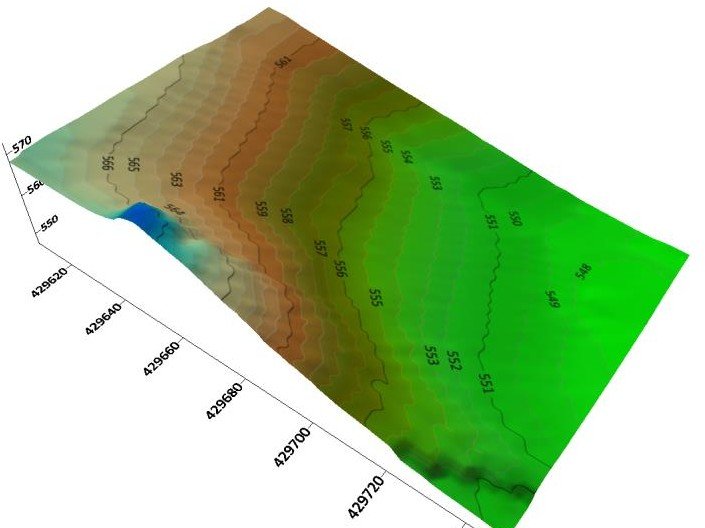
3D terrain model, Cisnădioara (Sibiu County). - slope, aspect and hypsometric maps from digital terrain models and LiDAR;
- mapping of landforms and active processes;
- morphometric analysis of river basins;
- support for field studies and technical documentation.
Floods
Where floodwater reaches and what is exposed: buildings, roads, networks and people.
- flood-prone areas, from the digital terrain model and hydrological data;
- flood scenarios by water level or return period;
- exposure of buildings, infrastructure and population;
- stormwater runoff in impervious urban areas.
Landslides
Unstable slopes, identified before they affect roads, networks or homes.
- landslide susceptibility maps from slope, lithology, land use and rainfall;
- a landslide inventory from orthophotos, LiDAR and field observation;
- exposed elements: roads, networks, buildings;
- priority areas for monitoring and intervention.
GIS for the environment
The state of the environment, mapped and measured over time, as a basis for permits, monitoring and reporting.
- maps of habitats, protected areas and sensitive zones;
- land use and how it changes, from satellite imagery;
- air, water and soil quality, linked to sources and receptors;
- mapping support for impact studies and environmental reporting.
Let’s talk about your data.
Tell us which grid, area or cemetery you would like us to assess and we will propose a pilot project with clear deliverables and a clear deadline.
Ask for a pilot projectContact
Let’s talk
Tell us how we can help and we will reply within one working day.
- OfficeSibiu, Romania
- Office hoursMonday – Friday, 09:00 – 18:00 (CET)
The first consultation is free